 three
visual effects of startle and distraction (dimmest flash), glare (brighter, making it hard to see out the cockpit) and temporary
flashblindness (loss of vision until the afterimage fades).
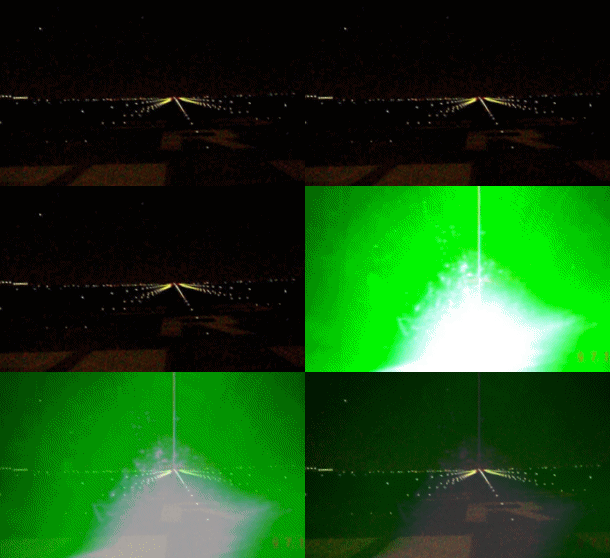
The 14-second-long
animation at right contains photos taken in a professional flight simulator during
scientific studies. It shows the
 three
visual effects of startle and distraction (dimmest flash), glare (brighter, making it hard to see out the cockpit) and temporary
flashblindness (loss of vision until the afterimage fades).
This animation is probably the most realistic way to understand what a laser exposure looks like. A still photo implies that the laser is always on the aircraft. But in real life, the laser flashes -- it is impossible to keep a hand-held beam fixed on a moving plane. Pilots generally experience one or more flashes as the beam sometimes hits, and mostly misses, the cockpit.
A typical flash from a hand-held laser at 1000 feet lasts about 1/50 of a second. In the FAA simulator studies, the flash used was one second long. The animation above "splits the difference" by using 1/2 second flashes. We feel this is a realistic portrayal of how long a typical exposure might last.
In addition, there is a 2-1/2 second fade-out after the brightest exposure. This demonstrates how an afterimage fades. To keep the file size down and the animation short, the fading was made faster than normal. In real life, it will take longer to fade and much longer for night vision to recover.
 In the animation, the power
levels are known. From this, we can compute distances if the light was from a
legal (5 mW) laser pointer. The
dimmest level corresponds to a legal laser pointer 3,700 feet away, the medium
level is a pointer about 1,200 feet away, and the brightest level is a pointer
just 350 feet away.
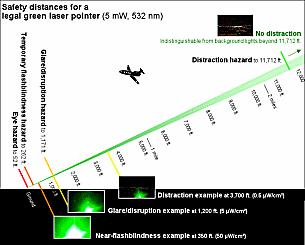
The diagram at right shows this more clearly. The diagram includes FAA-determined safety distances for flashblindness, glare and distraction. You can see where the simulator photos fall, on this distance scale. Click here or on the diagram for an enlarged view.
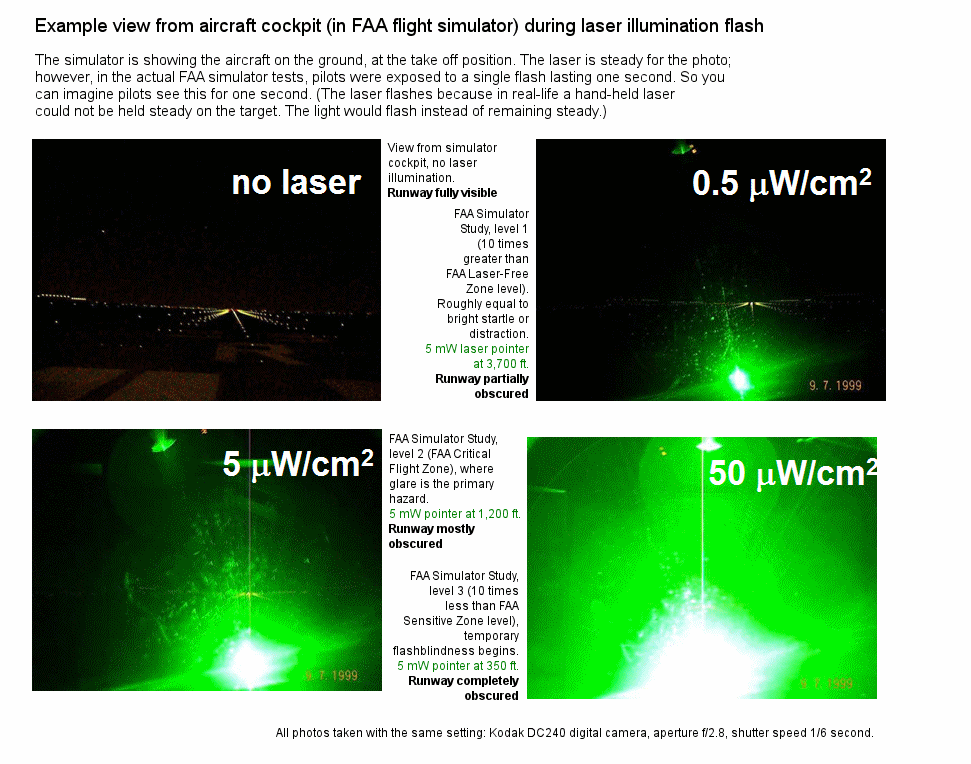
The graphic below explains
details the
various power levels, and the visual levels to which they correspond. As you
read about the various levels, you may also want to reference the diagram above,
as well as
this table which shows
distances for a laser pointer to reach various safety zones.
